Home
About Us
Screen Shots
Contact Us
Downloads
Purchase DIAB
System Requirements
SQL every DBA
needs
Sitemap

|
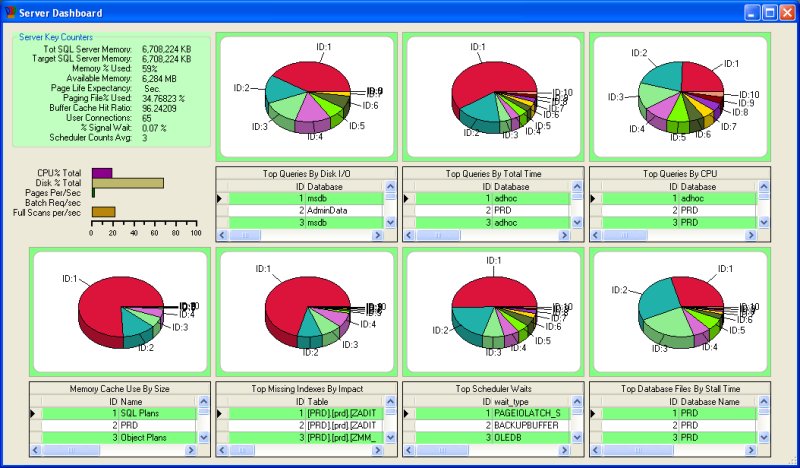
DIAB's Top
10 Scorecard can help you determine what is
impacting your server the most.

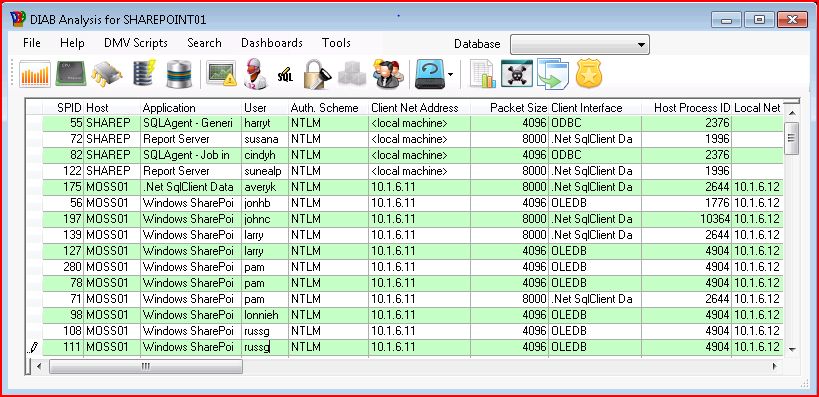
DIAB
Analysis is the start point for problem solving. This screen shot
is
displaying Sessions from the DMV scripts This shows detailed
information about the connections to a SQL Server.
Job History for tracking query
performance
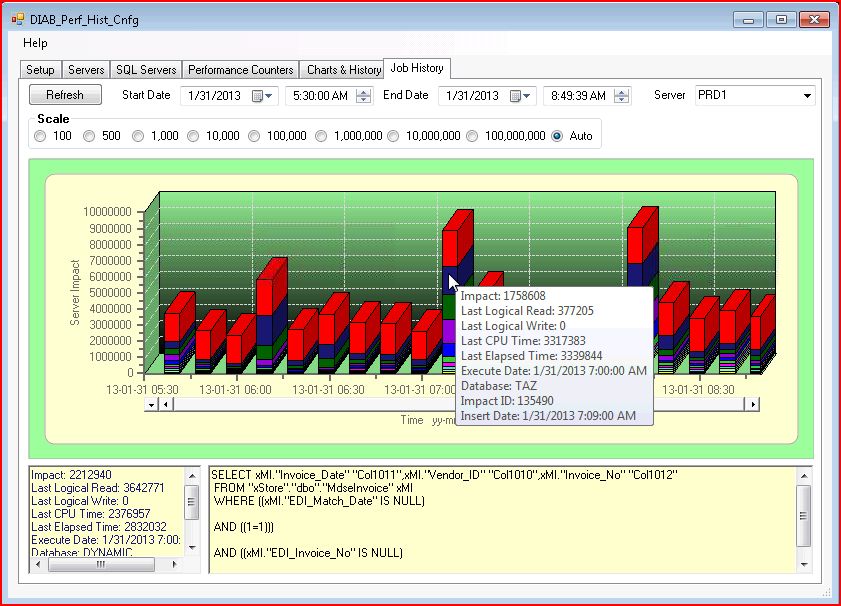
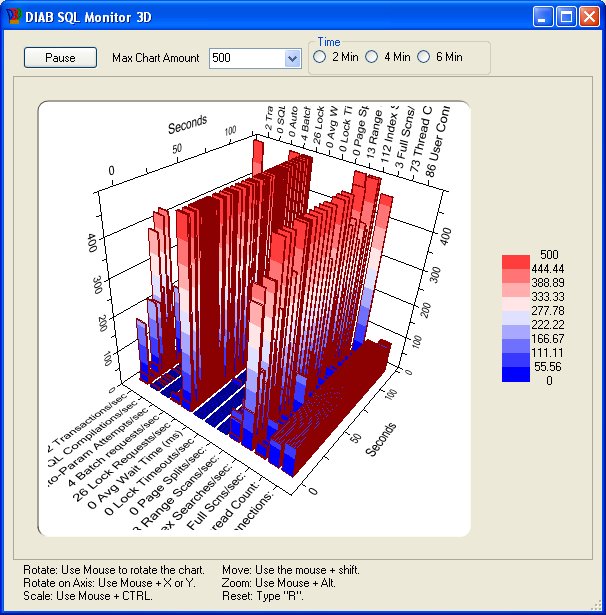
3D Realtime
Charts display server performan in a whole new light. All 3D
charts allow for rotate, tilt, zoom,
and
resizing.

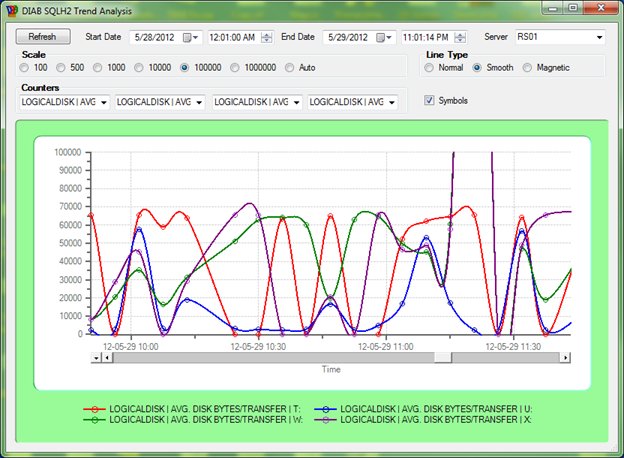
DIAB
integrates with SQLH2 for trend analysis and historical data.

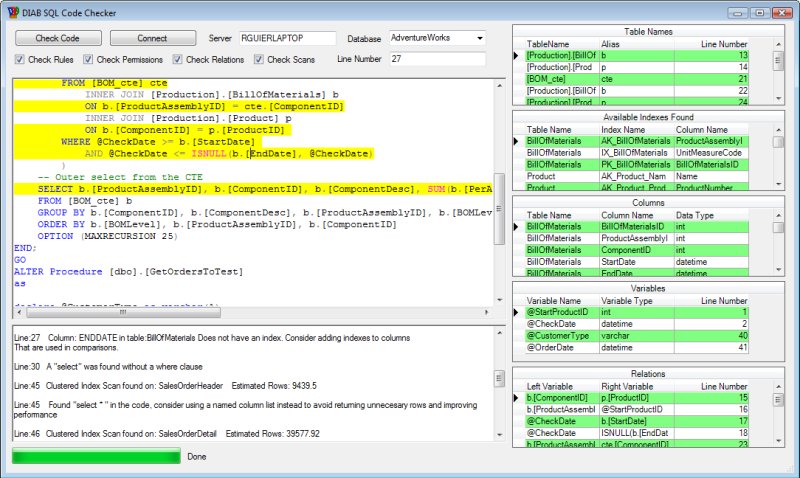
SQL
Code Checker verifies sql code for SOX
compliance, security,
SQL
best practices, and table and clustered index scans.

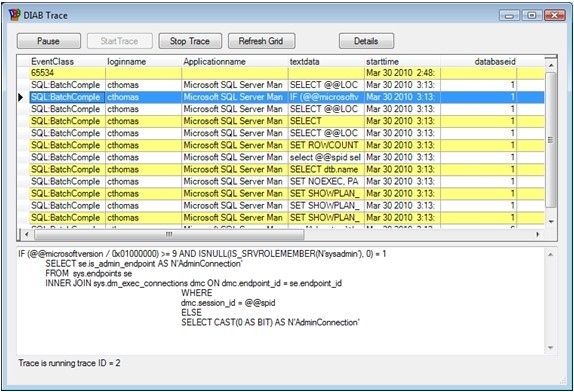
The
trace menu executes a fast trace on a SPID, login or application
for problem
analysis. Quickly identify
deadlocks,
find exact instructions in complex applications causing failures,
freeze the trace and step through the code from the moment an
application starts to the point of failure. DIAB Trace is
also much easier and quicker to user than SQL
profiler.
Figure
7

Analyzing
the Hardware
Selecting
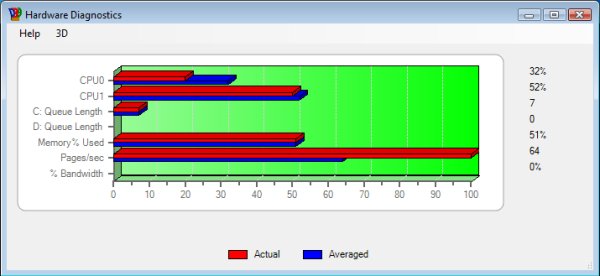
Quick Diagnostics will give you a fast overview of
what’s happing with CPU, drive utilization, memory, and network
bandwidth on the server in real time. From here you can decide whether
to
dig into diagnosing the hardware or quickly move to diagnosing the
queries. There are no refresh buttons to push and no
reports to run, just fast results while they’re happening. The screen below
shows the C: drive is taking a huge load and paging is
being heavily
used.
Figure 8

Monitoring
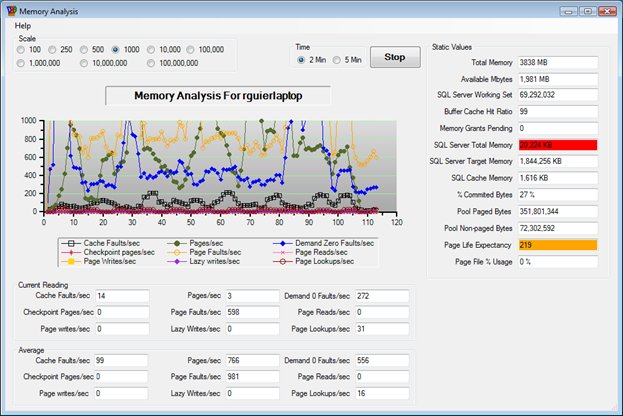
memory issues can be one of the hardest chores a DBA can encounter.
There are hundreds of counters you can monitor but DIAB has the key
counters right at your fingertips, Below we see a high volume
of
paging which could mean it's time to investigate how memory is being
utilized.

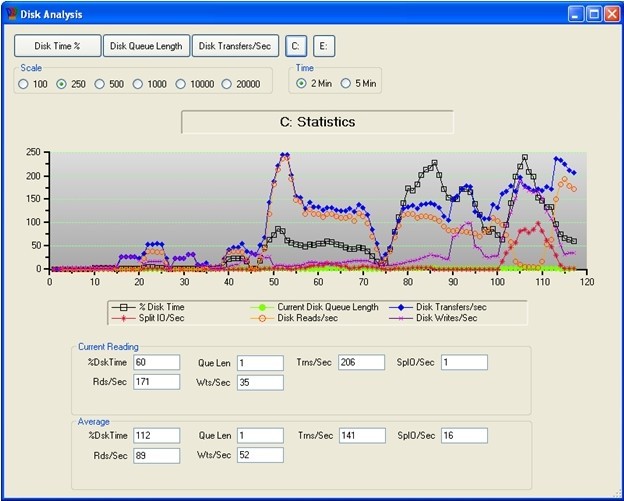
Disk
diagnostics probably consumes a DBA’s life more than
anything else. Without the proper knowledge of disk configuration
techniques,
you may quickly find yourself in trouble. Consider all the things in
designing
a server that affect disk performance: file groups, raid levels, temp
storage, logging, replication, indexing, it’s an endless list. DIAB
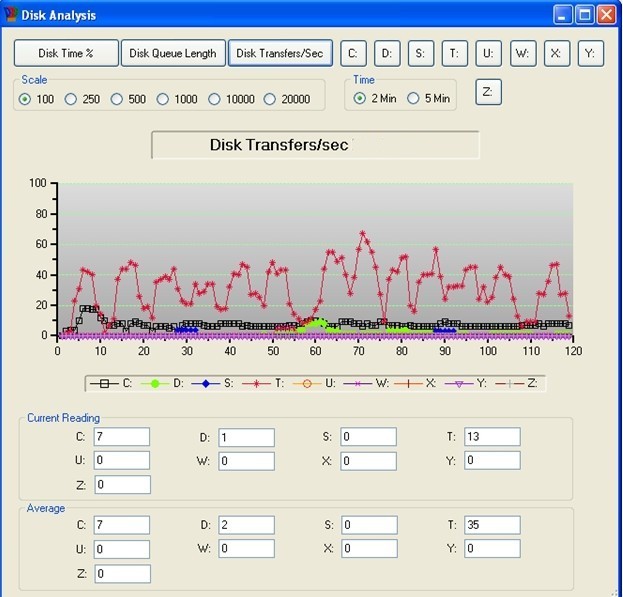
Disk Analysis will quickly help you determine which disks are
problematic.

Click
any one of the drive command buttons
and dig even
deeper into what’s happening on a single drive. The screen below shows
the C: drive getting hammered, disk queue is above 0
and
we have
a high volume of transactions.

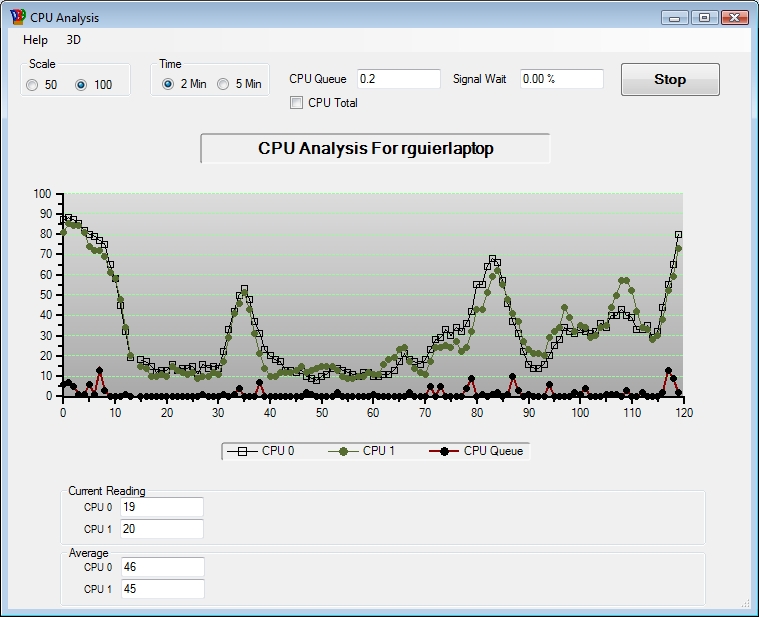
CPU
Analysis will quickly
tell you if your CPU's are being overwhelmed.

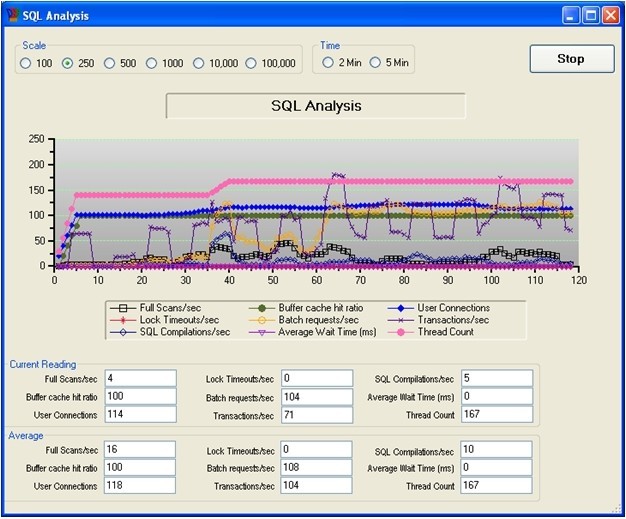
SQL Analysis
SQL Analysis displays important
counters that
can be used to identify slow server performance. Notice the
counter, Full
Scans/sec displaying some high numbers, this may be an indicator you
need some
indexes.

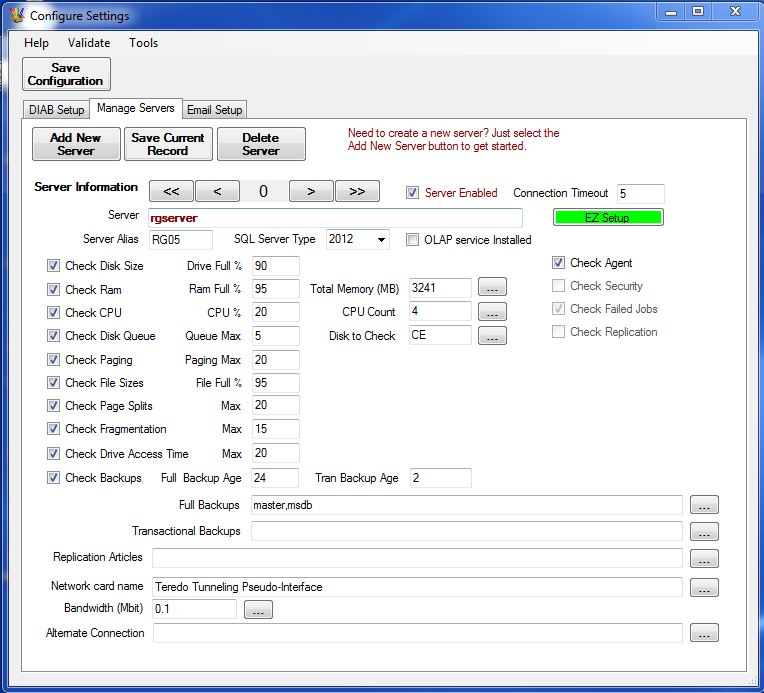
Configuring DIAB
DIAB’s
configuration menu is easy to navigate. Tooltips will help you
with entering the
information about
your servers. EZ setup
makes entering information about your servers easy by
automatically filling in the the information for you.
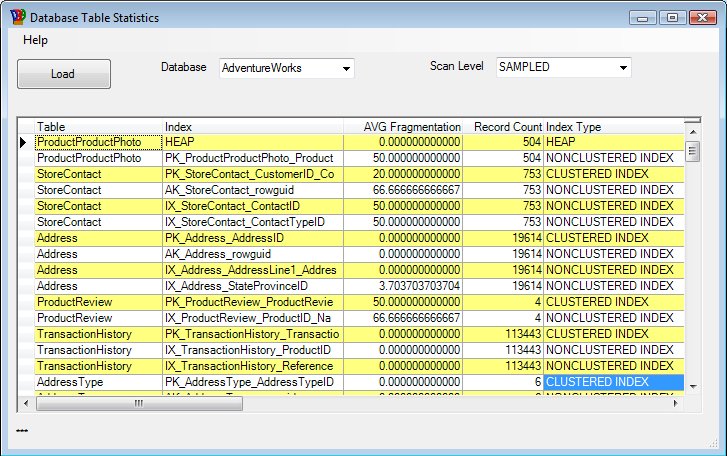
Database Statistics
DIAB makes
it easy to gather information about your database tables. Table
statistics data can help you identify which tables need to be
reindexed, archived, or normalized.

|
 Screen shots showing DIAB's assortment of tools to monitor, troubleshoot, and improve
SQL Server Performance
